Paraíba do Sul (Brazil)
Hydrology
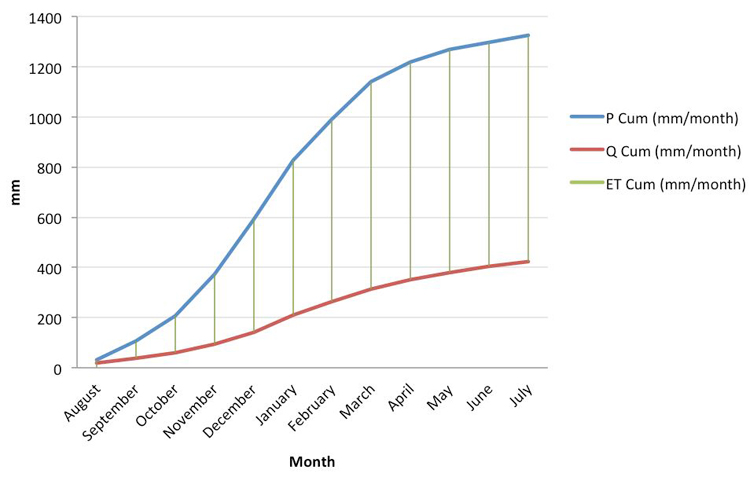
For the period of 1975 to 2004 (30 years) the water balance has been calculated. Input data were obtained from the database of the Agência Nacional de Águas (ANA, 2014). The figure above illustrates the cumulated precipitation and discharge values for the hydrological year (August to July).
The annual precipitation amounts to approximately 1326 mm. Each monthly precipitation value represents a correlation of the datasets of 11 measurement stations. The stations are evenly distributed over the basin. Even though at some measurement station, such as Ponte Alta 1, precipitation values reach up to 2000 mm per year due to orographic conditions, large areas of the PDS river basin are characterized by less than 1500 mm of precipitation per year.
Monthly discharge values were calculated for the measurement station Campos – Ponte Municipal, which is located close to the outlet. The annual discharge amounts to around 424 mm. Consequently, the annual evapotranspiration amounts to around 900 mm per year. The large sum is caused by year around high temperatures in southeast Brazil.
Due to its geographical location, the basin is prone to natural hazards such as floods and droughts. Exceptionally wet years occurred in 1983, 2000, 2008, 2009 and 2010; whereas severe droughts took place in1943/1944, 1953-1957, 1963, 1968, 1984, 1994, 1997 and 2001 (Simões & Trannin, 2013). The last drought occurred in 2014.
The water quality of the PDS basin is greatly altered and compromised by human activities. A variety of water quality parameters such as turbidity, phosphorous, dissolved oxygen, BOD, COD, total solids or metals, show critical values. In March 2005, the Ministry of Environment adopted resolution No 357. The resolution defines tolerable values for water quality parameters. Table 2 shows the violations of the measured values in the PDS basin from the tolerable values. Highest violations between 25 to 99 per cent are found for metals such as Cadnium, Iron, Plumb, Copper or Aluminium, attributable to the effluents of present metal industries. In the case of Aluminium, the situation is very critical. The uptake of Aluminium is as toxic to the marine environment as it is for humans. It may cause bone diseases, anorexia or the Alzheimer disease (AGEVAP, 2006). However, the great violation is also attributable to the natural origin of Aluminium. Measurement stations located in sections with optimal water quality also show high Aluminium concentrations (AGEVAP, 2006). Other than this, high coliform bacteria violations indicate high biochemical and chemical oxygen demands, attributable to the continuous pollution from organic materials (Queiroz et al., 2014). Such pollution is due to the lack of sewage collection and treatment plants. In São Paulo 80 per cent of the wastewater is collected, but only 10 per cent is treated (Souza, 2004). In Minas Gerais and Rio de Janeiro less than 50 per cent of sewage is collected, of which only 2 per cent is treated (Souza, 2004). Every day, around 5 million cubic metre of water are extracted for human consumption, of which 50 per cent is used by the industrial sector (Garcia, 2012).
Table: Violations of Water Quality Parameters (Metzke, 2014)
| Position | Parameter | Average Violation (in %) |
Standard Deviation |
| 1 | Aluminium | 98,9 | 2,8 |
| 2 | Sulfites | 83,1 | 7,9 |
| 3 | Plumb | 78 | 35,3 |
| 4 | Coliform (fecal) | 77,8 | 27,2 |
| 5 | Cadmium | 66,7 | 43,8 |
| 6 | Coliform (total) | 58,7 | 29,6 |
| 7 | Iron (soluble) | 33,7 | 17,7 |
| 8 | Phosphorous (total) | 25,3 | 25,7 |
| 9 | Copper | 23,4 | 32,2 |
| 10 | Manganese | 21,3 | 25,6 |
| 11 | Phenols | 13,8 | 13,1 |
| 12 | BOD | 11,8 | 23,5 |
| 13 | Mercury | 11,3 | 21,1 |
| 14 | Nickel | 3,4 | 5,1 |
| 15 | Turbidity | 3,2 | 5,5 |
| 16 | Benzo(a)pyrene | 2,9 | 5,4 |
| 17 | Ammonium | 2,1 | 10 |
| 18 | Zinc | 1,9 | 8,7 |
| 19 | Real Colour | 0,9 | 3,9 |
| 20 | Barium | 0,3 | 1,6 |
| 21 | Chromium | 0,2 | 0,8 |
| 22 | Total Dissolved Solids | 0,2 | 1 |
| 23 | pH | 0,1 | 0,3 |
| 24 | Chlorine | 0 | 0,1 |
| 25 | Fluorides | 0 | 0 |
| 26 | Nitrate | 0 | 0 |
| 27 | Chlorophyll | 0 | 0 |
| 28 | Arsenic | 0 | 0 |
| 29 | Boron (soluble) | 0 | 0 |
| 30 | Nitrite | 0 | 0 |
| 31 | Sulphates | 0 | 0 |
Hydrological Borders
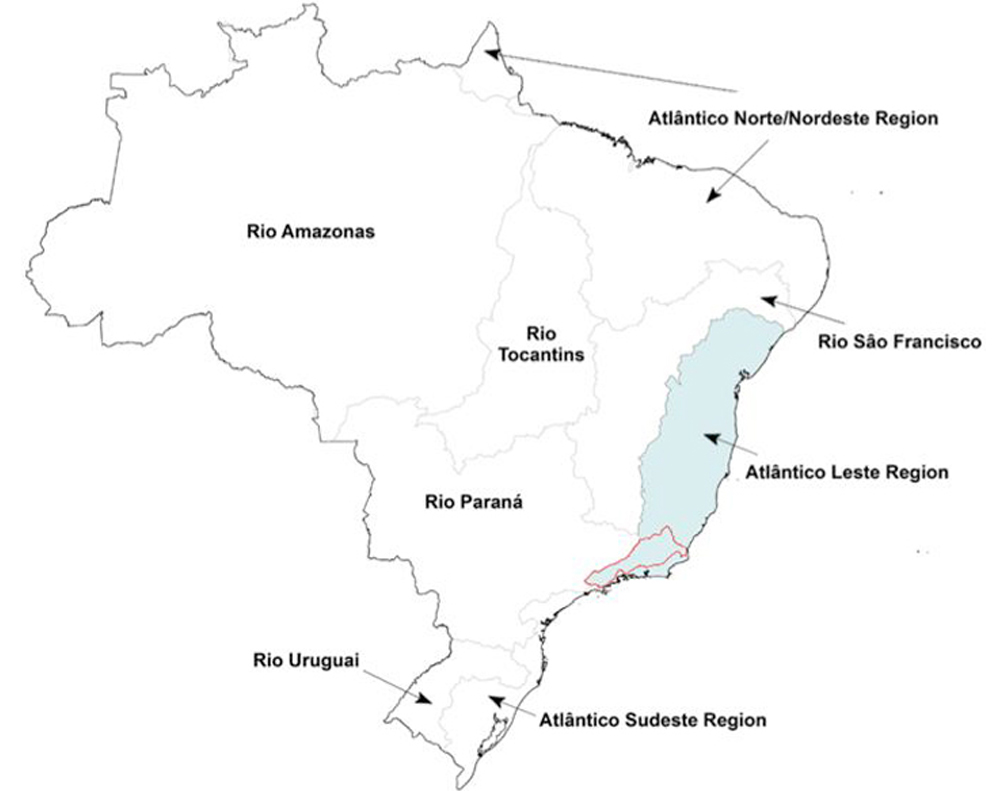
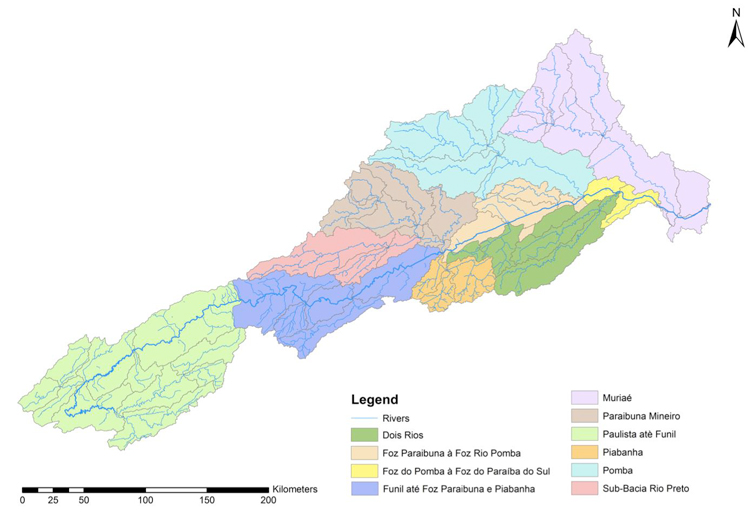
The PDS belongs to the Atlântico Leste hydrographical region, bordering with the Rio Paraná region in the northwest and the Atlântico Sudeste region in the southwest. The basin is divided into 10 sub-basins. The sub-basins of São Paulo are located upstream, while the sub-basins of Minas Gerais and Rio de Janeiro are located downstream.
The main stream has a length of approximately 1075 kilometres. From its source at Serra da Bocaina (São Paulo), the river flows west before it changes its course to east at the city of Guararema. The PDS drains into the Atlantic Ocean in the district of Atafona, which is part of the municipality of São João da Barra.
References and further reading:
ANA 2014. Agência Nacional de Águas. http://hidroweb.ana.gov.br. Accessed: 01.11.2014.
AGEVAP 2006. Associação Pró-Gestão das Águas da Bacia Hidrográfica do Rio Paraíba do Sul. Plano de Recursos Hídricos da Bacia do Rio Paraíba do Sul – Resumo. http://www.ceivap.org.br/downloads/PSR-010-R0.pdf. Accessed: 02.12.2014.
Garcia, A. C.; Napoleão, D. A. S.; Siqueira, A. F. & Filho, H. J. I. 2012. Water Monitoring of Paraíba do Sul River in the City of Lorena – SP, Brazil. http://ijepr.avestia.com/2012/PDF/005.pdf. Accessed: 29.11.2014.
Queiroz, L.G.; Almeida, É. C.; Tominaga, F. K.; Silva, F. T. & Paiva, T. C. B. 2014. Physico-chemical, Biological and Ecotoxicological Characterization of the Water from Paraíba do Sul River in Brazil. http://avestia.com/ICEPR2014_Proceedings/papers/86.pdf. Accessed: 03.12.2014.
Souza, D. I., 2004. A Degradacão da Bacia do Rio Paraíba do Sul. http://www.uff.br/engevista/3_6Engevista8.pdf. Accessed: 04.12.2014.